Introduction
Every investor has a goal.
Some are building a long-term portfolio. Others follow daily opportunities, while some prefer to understand the market before making any move.
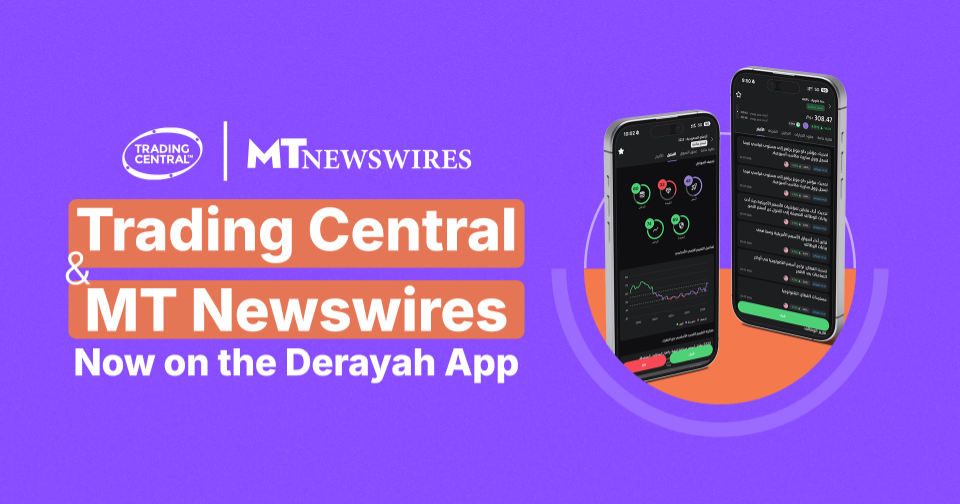
With the new Derayah app, it is easier to follow news and analysis for the Saudi and U.S. markets directly from the app.
What’s New in the Update?
The update gives you access to:
- U.S. market news directly inside the app
- Trading Central analysis for the Saudi and U.S. markets
- Fundamental analysis, quantitative models, and technical analysis
- An AI assistant that helps you understand stock/company more easily
How Can I Follow U.S. Market News Inside the App?
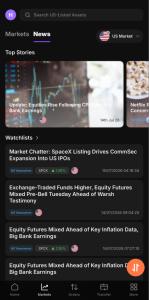
You can follow U.S. market news through MT Newswires, a global financial news provider, directly from the Derayah app.
You can find the news under:
Markets > News
The news is organized into the following categories:
- Top News
- News related to your watchlist
- All News
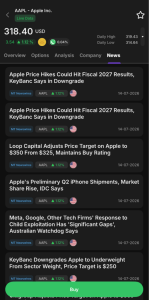
You can also visit an individual stock page and view news related specifically to that company through:
Stock Page > News
How Does U.S. Market News Help Me?
Let’s say you are following the stock of a U.S. technology company.
The company may announce its financial results, sign a new contract, or revise its outlook for the coming period.
From the stock page, you can view the news and connect it to the stock’s movement more quickly.
This helps you understand why the stock rose, declined, or attracted increased market attention.
What Is Trading Central Analysis?

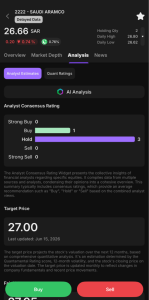
Trading Central provides analysis that helps you assess a stock from different perspectives.
The available tools include:
- Fundamental analysis
- Quantitative models
- Technical analysis
- AI assistant
The feature supports assets listed in both the Saudi and U.S. markets.
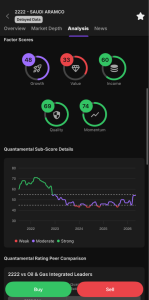
What Is Fundamental Analysis?
Fundamental analysis helps you understand the company itself.
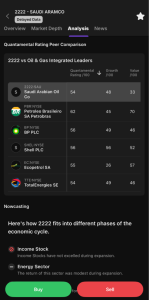
It allows you to review indicators such as growth, value, quality, and momentum, and compare companies within the same sector more clearly.
Example
Stock A
The company is showing solid growth, improving earnings, and an analytical rating above the sector average.
Stock B
The company is growing more slowly, its earnings are inconsistent, and its rating is lower than similar companies.
In this case, fundamental analysis helps you understand the difference between the two stocks based on company performance and key indicators.
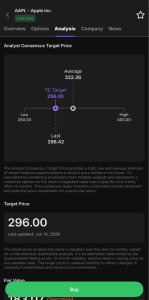
What Are Quantitative Models?
Quantitative models provide insights based on data and multiple evaluation criteria.
They organize the numbers in a clearer way and help you identify which stocks are showing stronger indicators based on the available data.
For example, imagine you are comparing two stocks:
Stock A
It has recently outperformed the market, shows strong momentum, and has a positive quantitative rating.
Stock B
It has delivered weaker performance, its movement is slower, and its quantitative rating is neutral.
The quantitative model gives you an additional perspective, helping you compare the two stocks more quickly and clearly.
How Does Technical Analysis Help Me?
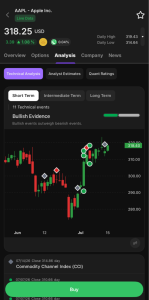
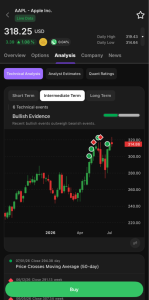
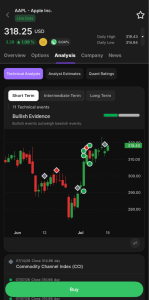
Technical analysis helps you follow a stock’s movement through its price chart.
You can view potential technical patterns and signals, such as a breakout above a certain level, a drop below a support level, or the beginning of an upward or downward trend.
For example, Stock A may remain below a certain price level for some time before breaking above it with higher trading volume. This could generate a bullish technical signal.
Stock B may approach a support level and then fall below it, potentially generating a bearish technical signal.
These signals help you understand the stock’s price movement, but they should not be considered a buy or sell decision on their own.
How Do I Use the AI Assistant?
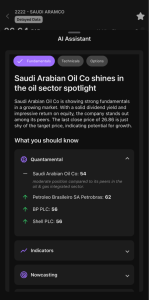
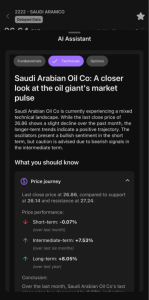
As part of the new update, the AI assistant helps you understand the analysis and indicators displayed on the stock page more easily.
While reviewing the analysis, the assistant provides clearer explanations of selected indicators, including trends, moving averages, and performance signals, helping you understand what they mean within the overall picture of the stock.
This allows you to review the analysis more quickly and understand the meaning of different indicators without unnecessary complexity before making your investment decision.
The Bottom Line
The new update makes it easier to follow the market directly from the Derayah app.
You can follow the latest news, access analysis for the Saudi and U.S. markets, compare stocks, and understand indicators more easily with the help of the AI assistant.
These tools give you a clearer view of the market and help you pursue your investment goals through more informed decisions.
Have a Question?
We are always here to help.
You can contact your dedicated Relationship Manager directly. Their contact details are available under your account inside the app.
Update the Derayah app now.